SEN 1441
- Details
- Category: Archive 2010
- Hits: 1786
- Sierra Cup Flash
- Statistical Analysis of finals drops
- Unobtainium?
Sierra Cup Flash
F1A
Jim Parker
John Cooper
Ittai Shichman
F1B
Walt Ghio
Alexander Andriukov
Bill Booth
F1C
Austin Gunder
Don Chesson
Ron McBurnett
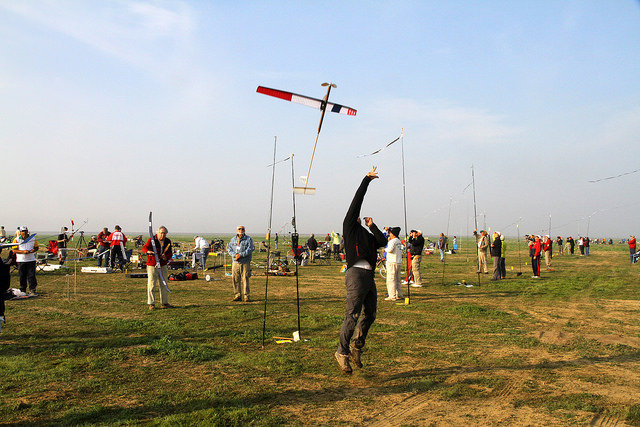
All event went to a 10 min fly off round the following morning. Great to see people from 3 different countries on the podium in F1A. Great event - well done to the McKeevers and friends.
Final's drop correlations
Aram Scholsberg
During the Finals, there was a long discussion about whether to move or
rotate the flight line, as the drift/wind tended to blow at 45 degrees or straight
down the “base” line along the east-west ridge line. After returning (exhausted)
from Lost Hills I ran statistics on the number of drops for each pole over the
two flying days for each event. My intuition or prior was that it mattered for
F1B, but not for F1A+C.
F1A: The overall correlation of drops to line position is 0.170, which means
that drops were slightly more frequent on the west side of the line. There was
no significant change in the drop pattern between day 2 and 3.
Pole | Drops | Correl: 0.170 | |
1 | 3 | ||
2 | 5 | ||
3 | 1 | ||
4 | 0 | ||
5 | 3 | ||
6 | 1 | 13 | 31.7% |
7 | 4 | ||
8 | 0 | ||
9 | 1 | ||
10 | 3 | ||
11 | 2 | ||
12 | 2 | 12 | 29.3% |
13 | 4 | ||
14 | 3 | ||
15 | 3 | ||
16 | 2 | ||
17 | 4 | 16 | 39.0% |
Sum | 41 | ||
F1B: The overall correlation was -.644, which means that drops occurred
primarily in the western part of the line - as expected. When the lone is
broken into quarters, 40.5% of the drops occurred in the first quarter, while
only 8.1% of the drops happened in the forth (western) quarter.
The patterns were quite different between days 1 and 3: 28 out of 37 drops
happened on day 1. There were two drop clusters on day 1, on the 4th
round 5 out of the 7 fliers between poles 3 and 9 dropped (Morrell,Schroedter,
Jenson, Vanlandingham and Ulm). Another drop cluster occurred in the 6th
round, with 8 put of the 10 fliers between poles 1 and 11 dropping (Veccaro,
Jones, Shailor, Batiuk, Crowley, Ghio, Rohrke, Schroedter). The drop
Pole | Drops | Correl: 0.603 | |
1 | 4 | ||
2 | 3 | ||
3 | 3 | ||
4 | 1 | ||
5 | 2 | ||
6 | 1 | 14 | 38.9% |
7 | 2 | ||
8 | 2 | ||
9 | 1 | ||
10 | 5 | ||
11 | 2 | ||
12 | 0 | 12 | 33.3% |
13 | 2 | ||
14 | 1 | ||
15 | 0 | ||
16 | 2 | ||
17 | 1 | ||
18 | 1 | 7 | 19.4% |
19 | 0 | ||
20 | 0 | ||
21 | 1 | ||
22 | 1 | ||
23 | 0 | ||
24 | 1 | 3 | 8.3% |
Sum | 36 | ||
F1C: The overall correlation of drops was 0.199, which means that more
F1C fliers tended to drop on the western part of the line. Day 1 had a drop
cluster on the 7th round, were 5 out of 7 fliers between poles 11 and 17
dropped (Servaites, Chesson, Ghio, Poti and Morris). The drop distribution
Pole | Drops | Correl: 0.199 | |
1 | 0 | ||
2 | 0 | ||
3 | 3 | ||
4 | 3 | ||
5 | 0 | ||
6 | 2 | 8 | 34.8% |
7 | 1 | ||
8 | 1 | ||
9 | 0 | ||
10 | 1 | ||
11 | 2 | ||
12 | 1 | 6 | 26.1% |
13 | 3 | ||
14 | 1 | ||
15 | 2 | ||
16 | 2 | ||
17 | 1 | 9 | 39.1% |
Sum | 23 | ||
Having the launch line perpendicular to the drift/wind only really matters
for F1B; it definitely impacts the F1B team selection. As a corollary, F1B
had two clear drop clusters. (F1C happened to have one drop cluster).
Hi, Does anybody have an idea where to get 2-3 grams beeper to a P-30 rubber powered motor? Also I am still looking for transparent (colorless) micafilm and TAN 2 99/5 rubber. If somebody would be interested to sell even just a little bit - that would be great.
Thanks,
BR,
Jukka --
Name -----------------------> Jukka Juslin
Tel ------------------------> +358 400 25 1816
Email ----------------------> This email address is being protected from spambots. You need JavaScript enabled to view it.
...............
Roger Morrell


